Visualizing interactive stories
August 12, 2017Visualization and analysis are important for any tool. Existing interactive fiction tools have many interesting visualization techniques.
They help by easily convey the shape and structure of your story’s architecture. They reveal how many different paths and endings your story has. They can also help identify “bugs” in the story rules.
My goal was to find an accurate way of visually representing stories made with the Elm Narrative Engine.
Unlike Twine or Choose Your Own Adventures stories, Elm Narrative Engine stories do not follow a branching pattern, which makes them much harder to represent.
More like adventure games, players can move throughout the story in different ways, sometimes returning to places they already visited in order to advance the plot, and sometimes simply walking in circles before finding the right way to move forward.
This makes it very difficult to decide what a successful path through the story is, and even more difficult to decide how to represent that path. Do you show a “bread crumb trail” of locations? Or do you show the story element that the player clicked on at each step? Or should it be the rule that advanced the story? Are the rules the “arrows” between “crumbs,” or are they the “crumbs” themselves?
More importantly, how do you avoid infinite circular paths, or unnecessary back-tracking? And can you show the structure in a single visualization, or do you need to add other axis, like color, animation, or user interaction?
Directed graphs

I looked towards force-directed graphs for inspiration. They were not a perfect fit conceptually, and I discovered I had some very interesting technical differences as well, but they were a good start.
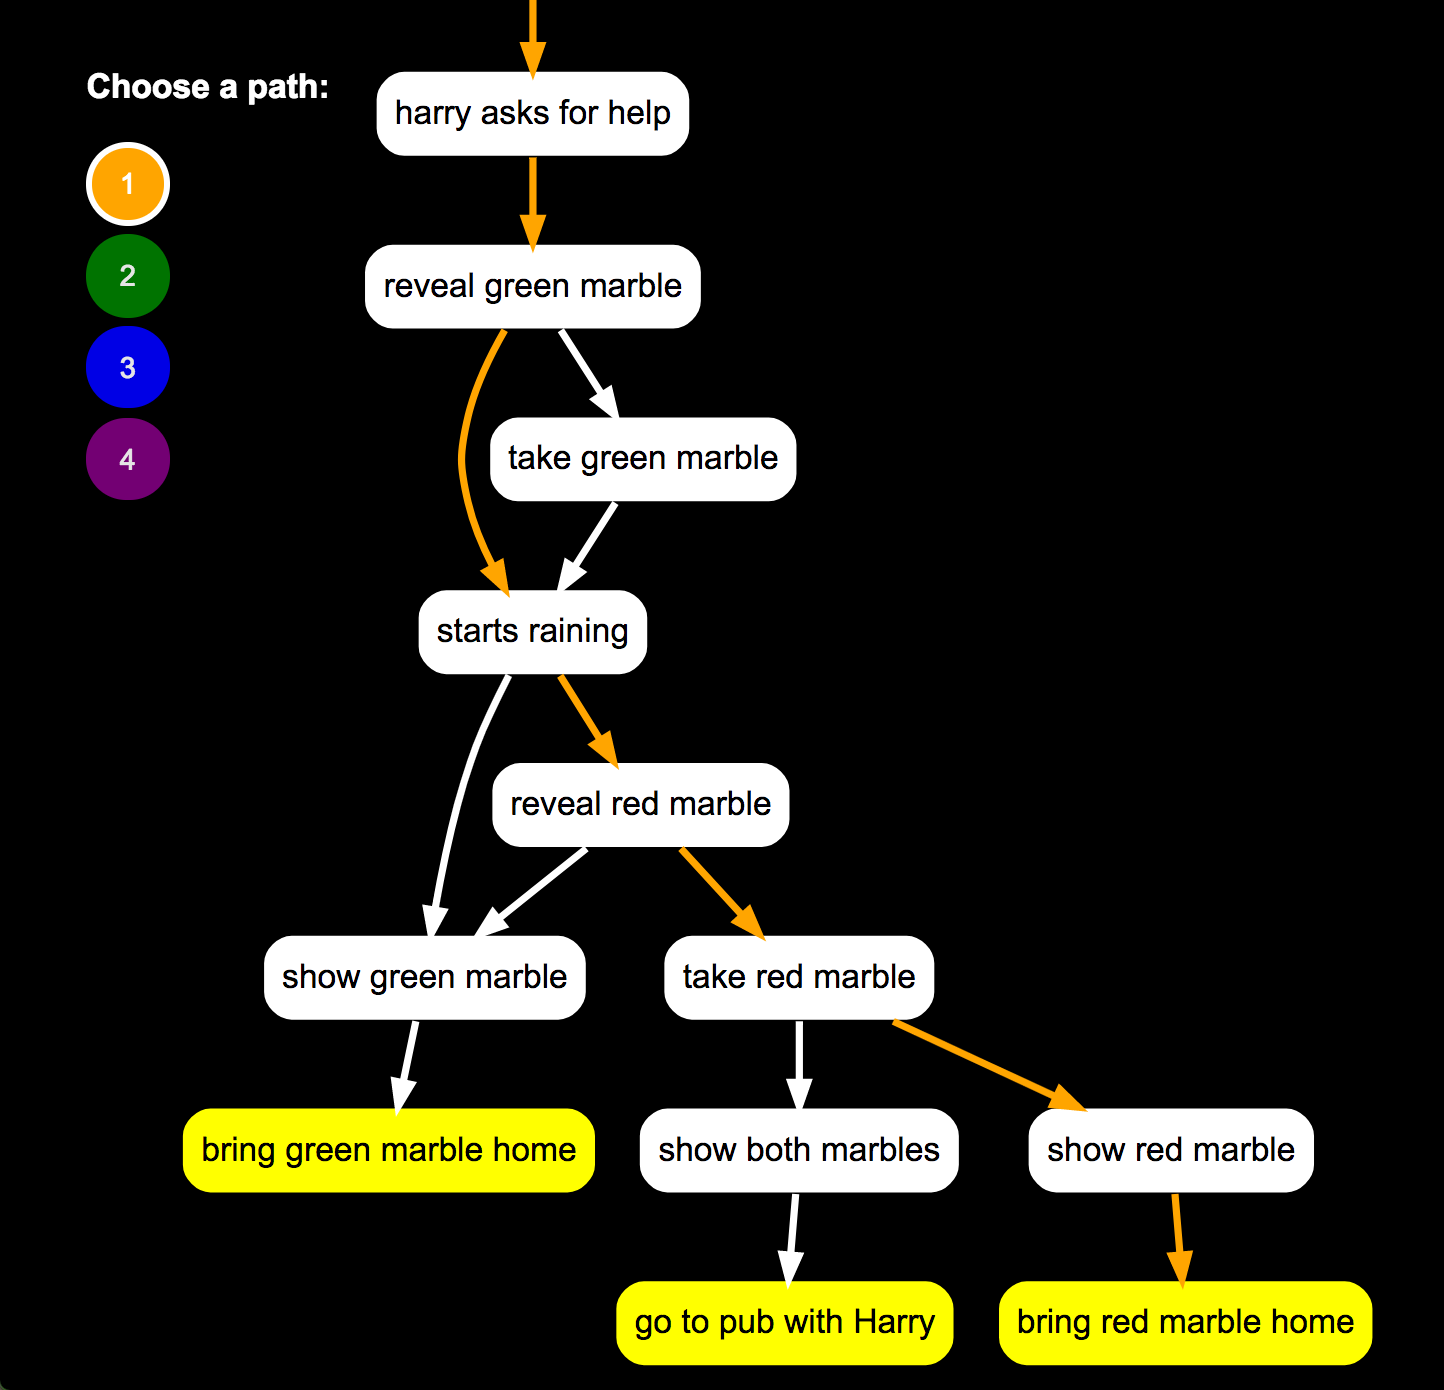
I decided that each rule’s summary should be a “node” in the graph, with arrows showing how a player could move from one rule to the next. I also wanted the arrows to flow in a single direction from the beginning point to one of the possible endings.
The first challenge was realizing that this method would show all possible paths between rules, without distinguishing order requirements. In other words, the graph would show all possible connections between all rules, but only by “highlighting” a discrete path would you be able to tell that the only way to get from node “L” to node “M” is if you passed through node “J” first.
I experimented with drawing multiple color-coded arrows to indicate this, but that quickly became too messy. I opted for adding a “legend” of all of the possible paths, allowing the user to interactively highlight a single path.
Programmatic playthroughs
Technically, my approach was to recursively “walk” the story, based on the defined story rules, by programmatically making every possible play at every step of the story. At each step I would gather what rule I triggered and how I got to that rule, then combine them all together in the end into a graph data type, which I could then render using a graph visualization tool.
One interesting challenge that I ran into was the circular nature of my graphs. Generally you want to work with “direction acyclic graphs” or “DAG’s.” However, because you can return to a story state that you were already in (think going back and forth between two locations, or picking up and putting down an item), I had cyclic graphs. Practically, this this meant my recursive code would go in circles for ever (until crashing the browser). I had to discover how to identify a cyclic pattern and stop that path in order to fix this problem.

Another challenge was that the graphs were very messy and confusing. A tree is an easy diagram to follow when thinking of paths through a story. But my graphs would loop back on themselves (such as when returning to a previous location, but with new items). Some rules added narrative texture, but did not advance the state of the world. Others moved the character through the story world, but didn’t have any ultimate consequence on the outcome of the story.
To solve this, I found ways to ignore these types of rules and not include them when drawing the graph, which made the graphs much clearer and more tree-like. It did mean losing some useful information and granularity, but it reveals the critical rules that effect the architecture of the story.
Try it out
You can play with what I made yourself.
First, go play the demo interactive story.
Then, go to the demo story visualization tool to see the graph of that story, and explore all of the possible paths you could have taken.
You can also see the code at https://github.com/jschomay/ene-graph. With a few modifications and caveats, you can use the code on your own stories.
The future
I was pleasantly surprised that this experiment worked so well, and I have tried it out with a few of my stories. It does have some limitations both technically and conceptually, which I am not certain how to overcome, but I think it is very useful for authors when building out their story, and I am thinking of adding it to my visual editor whenever that part of the project comes together.
The original inspiration for this idea was from a conversation with Evan Czaplicki, who suggested the possibility of programmatically checking a story for correctness. Indeed, testing your interactive stories as you write is a very time-consuming and meticulous task. Play testing is required to make sure the right things happen at the right times, and that you can’t do something that you shouldn’t be able to do, and to make sure you can always continue playing to an ending without getting stuck. This tool does not catch all of those problems, but it certainly helps quite a bit, without requiring constant manual playthroughs. Just the fact that the computer can automatically play every possible path through your story is very valuable.
If you have some thoughts about this tool, or feature suggestions please either leave a comment below, or open an issue on the github repository above.